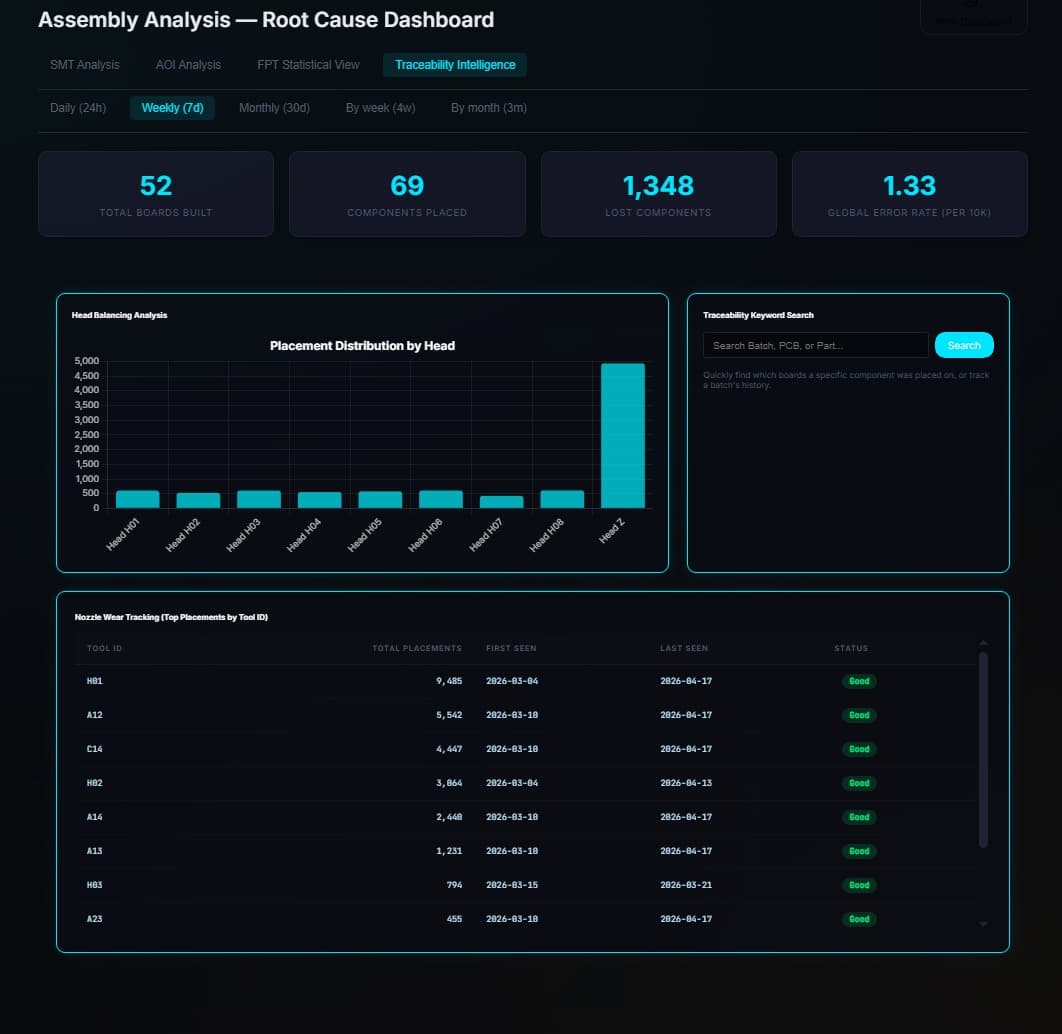
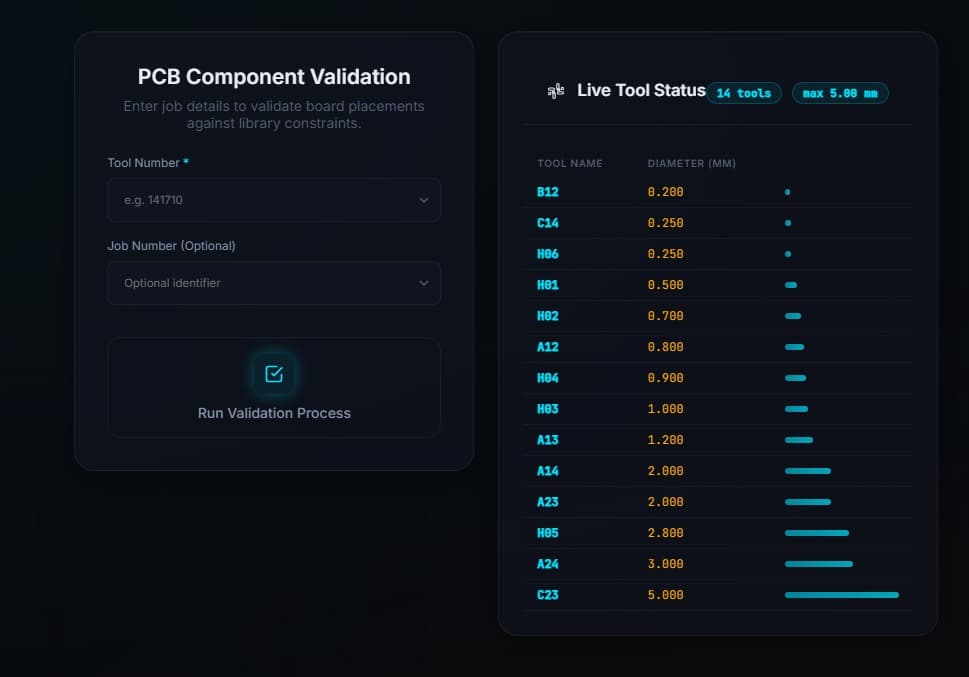
Real-time assembly analysis dashboard
Interactive manufacturing dashboard linking AOI and flying probe signals for root-cause work with guided troubleshooting tabs.
Role: Process Engineer / Software Developer — Integrated Test Corporation (ITC), 2023–2025
Stack: Python, charting, manufacturing data integration

// Highlights
- Real-time charts for error logs, failure rates, and line health.
- Linked AOI and flying probe data to isolate component-level root causes.
- Automated suggestions from failure messages plus process tabs for deep dives.
// Problem
Assembly engineers needed a single place to see live line health and to connect disparate test modalities when diagnosing recurring component issues.
// Approach
Designed an interactive dashboard that unified AOI and flying probe streams, encoded failure-message heuristics into suggested next checks, and organized workflows into process-specific tabs.
// Outcome
Faster convergence from symptom to likely cause, with less context switching between tools during high-pressure builds.
// AI & orchestration
Engineers needed a single interface that preserved context across AOI and flying probe data while keeping drill-down fast under build pressure.
Pattern: Unify streams → align timestamps/identifiers → surface suggestions as heuristics → provide structured tabs for deep investigation.
// Technical notes
- Shared time alignment across modalities for coherent drill-down.
- Extensible tab model so new failure classes could be onboarded without redesign.
// Metrics
Unified AOI + flying probe signals in one dashboard
Real-time charts + guided troubleshooting tabs