
From Raw Machine Logs to Predictive Maintenance: Time-Series Analytics in SMT
Raw machine telemetry tells you what happened. Time-series analytics tells you what is about to happen. Here is how First-Pass Yield, rolling defect rates, and SQL-driven root cause analysis work together.
- Published
- April 6, 2026
- Author
- Hrushiekesh Kanjula Reddy
- Read time
- ~7 min
- Category
- engineering
Every SMT placement machine generates a continuous stream of log data: component picks, placement coordinates, error codes, machine head temperatures, nozzle vacuum readings. Individually, each log entry is a historical fact. Aggregated over time, they form a pattern — and patterns in machine behavior predict failures before they happen.
The assembly hub's analytics layer transforms raw telemetry into three tiers of manufacturing intelligence: descriptive (what happened), diagnostic (why it happened), and predictive (what will happen next). Here's how each tier is built.
First-Pass Yield: The Foundational Metric
First-Pass Yield (FPY) is the percentage of boards that pass all quality inspections without requiring any rework. It's the single most important quality metric in electronics manufacturing, and computing it correctly requires cross-referencing production records against inspection results.
The mathematical definition is straightforward:
FPY = (Boards passing all inspections) / (Total boards produced) × 100
But computing it from real production data requires careful handling of rework records. A board that fails AOI, gets reworked, and then passes is not a first-pass yield. The SQL view that computes FPY uses a NOT EXISTS subquery to exclude boards with any rework record:
CREATE VIEW first_pass_yield AS
SELECT
    DATE(production_date) as day,
    COUNT(*) as total_boards,
    SUM(CASE WHEN NOT EXISTS (
        SELECT 1 FROM rework_records r
        WHERE r.board_serial = b.serial_number
    ) AND b.final_status = 'PASS' THEN 1 ELSE 0 END) as first_pass_boards,
    ROUND(100.0 * first_pass_boards / total_boards, 2) as fpy_percent
FROM boards b
GROUP BY DATE(production_date);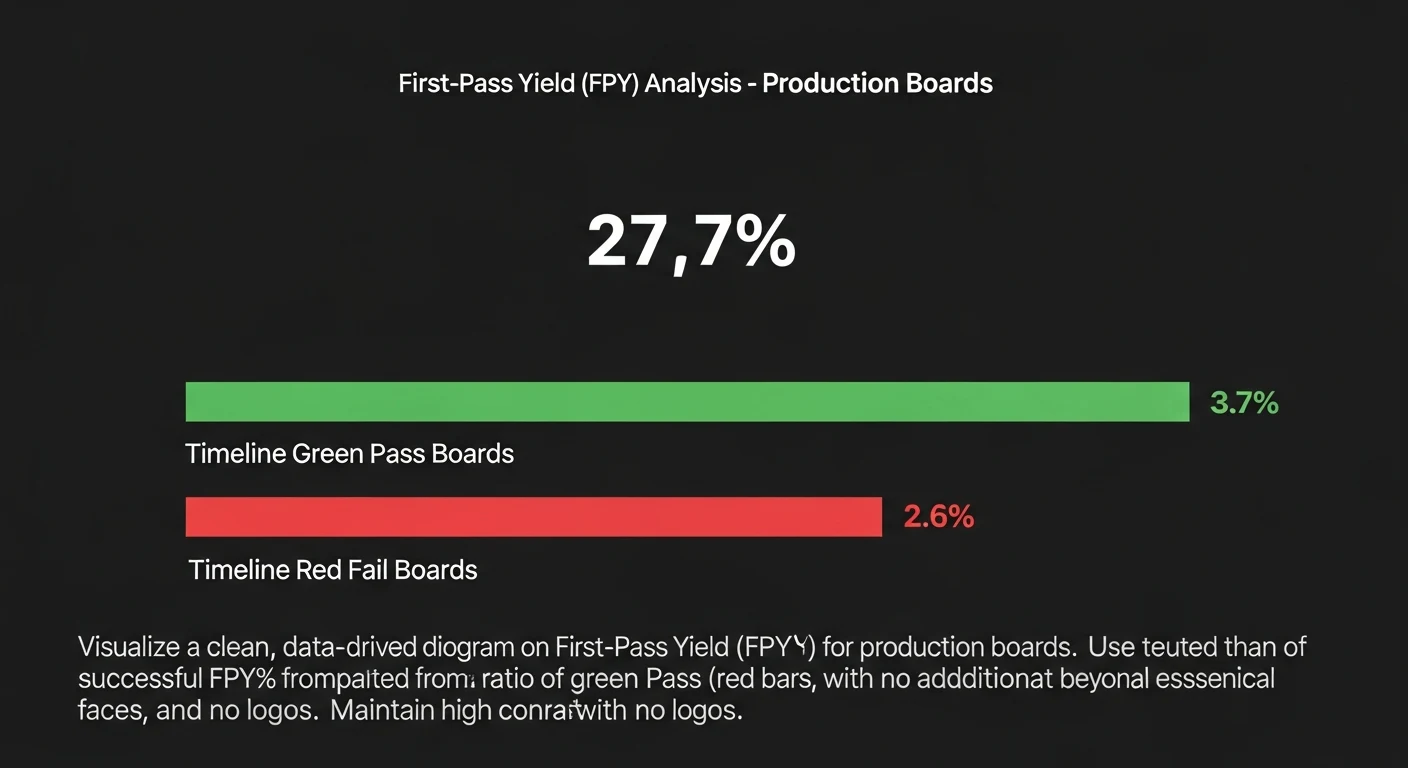
Rolling Defect Rate Normalization
Daily defect counts are noisy — a slow production day has fewer total components placed, so even a small absolute number of defects produces a high defect rate. The standard normalization is defects per 10,000 component opportunities (DPMO divided by 10):
Normalized Defect Rate = (Total defects / Total components placed) × 10,000
Computing rolling versions of this — 7-day rolling, 30-day rolling — requires SQL window functions:
SELECT
    day,
    defects,
    components_placed,
    ROUND(10000.0 * SUM(defects) OVER w7 /
          NULLIF(SUM(components_placed) OVER w7, 0), 2) as rolling_7d_rate,
    ROUND(10000.0 * SUM(defects) OVER w30 /
          NULLIF(SUM(components_placed) OVER w30, 0), 2) as rolling_30d_rate
FROM daily_production_summary
WINDOW
    w7 AS (ORDER BY day ROWS BETWEEN 6 PRECEDING AND CURRENT ROW),
    w30 AS (ORDER BY day ROWS BETWEEN 29 PRECEDING AND CURRENT ROW);
The rolling rate smooths day-to-day noise and reveals trends that individual daily readings obscure — a gradual increase in the rolling 7-day rate is an early warning that daily counts alone wouldn't surface.
Root Cause Analysis via Weighted Scoring
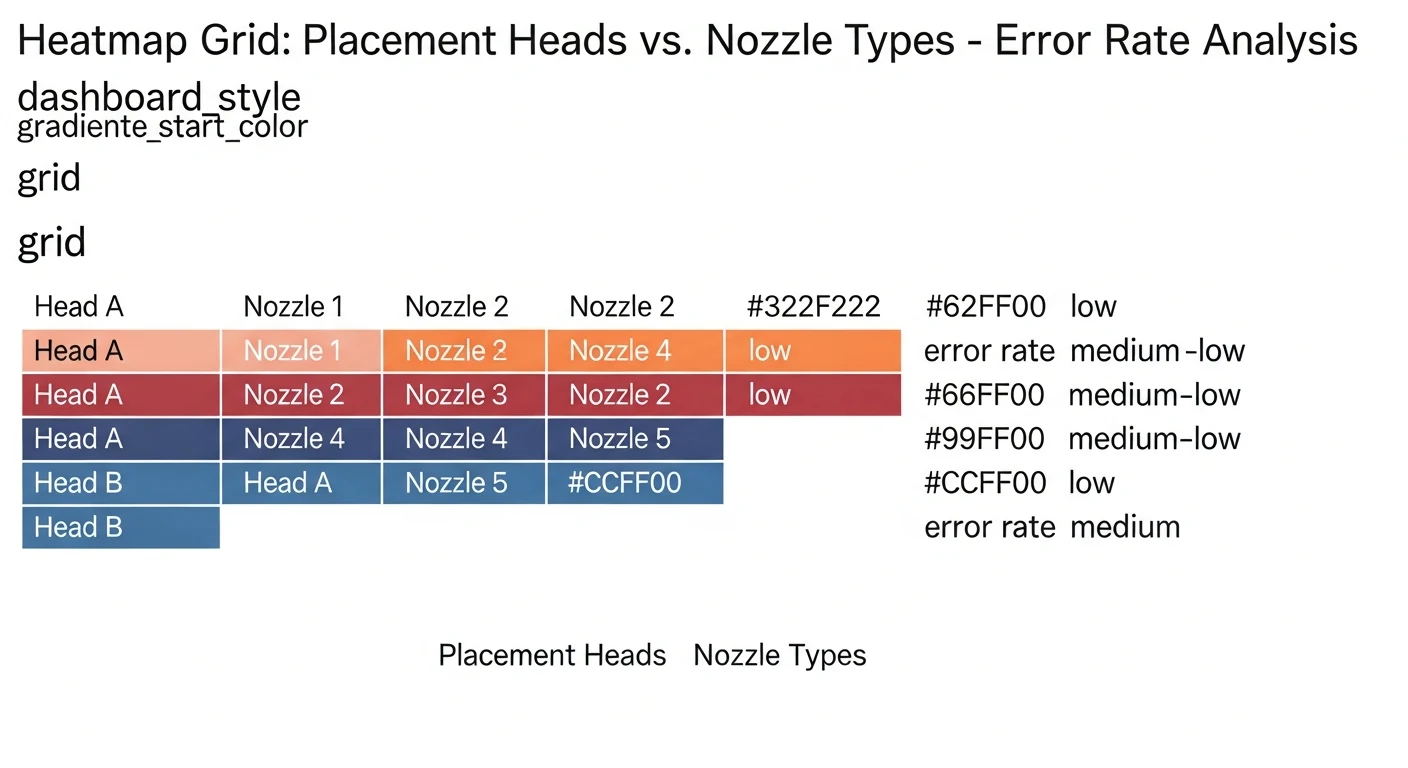
When the rolling defect rate trends upward, the next question is: which machine component is responsible? The root cause analysis (RCA) layer answers this by correlating defects with the mechanical context of each placement — which machine head made the pick, which nozzle type was used, which tool was active.
The RCA query aggregates error codes by mechanical context and applies a weighted scoring algorithm that prioritizes systematic failures over random noise:
SELECT
    placement_head,
    nozzle_type,
    COUNT(*) as error_count,
    COUNT(*) * 1.0 / SUM(COUNT(*)) OVER (PARTITION BY placement_head) as head_share,
    CASE
        WHEN COUNT(*) > 50 AND head_share > 0.4 THEN 'CRITICAL'
        WHEN COUNT(*) > 20 AND head_share > 0.25 THEN 'WARNING'
        ELSE 'MONITOR'
    END as severity
FROM machine_error_log mel
JOIN placements p ON mel.placement_id = p.id
WHERE mel.timestamp > DATE('now', '-7 days')
GROUP BY placement_head, nozzle_type
ORDER BY error_count DESC;
A placement head accounting for 40%+ of all errors on that machine is a nozzle maintenance candidate. A nozzle type consistently appearing in the CRITICAL tier across multiple heads suggests a batch quality issue with that nozzle supplier.
Hardware Degradation Signatures
Some machine failures announce themselves suddenly. Most degrade gradually, and the gradual cases are the ones that analytics can catch before they cause production disruptions.
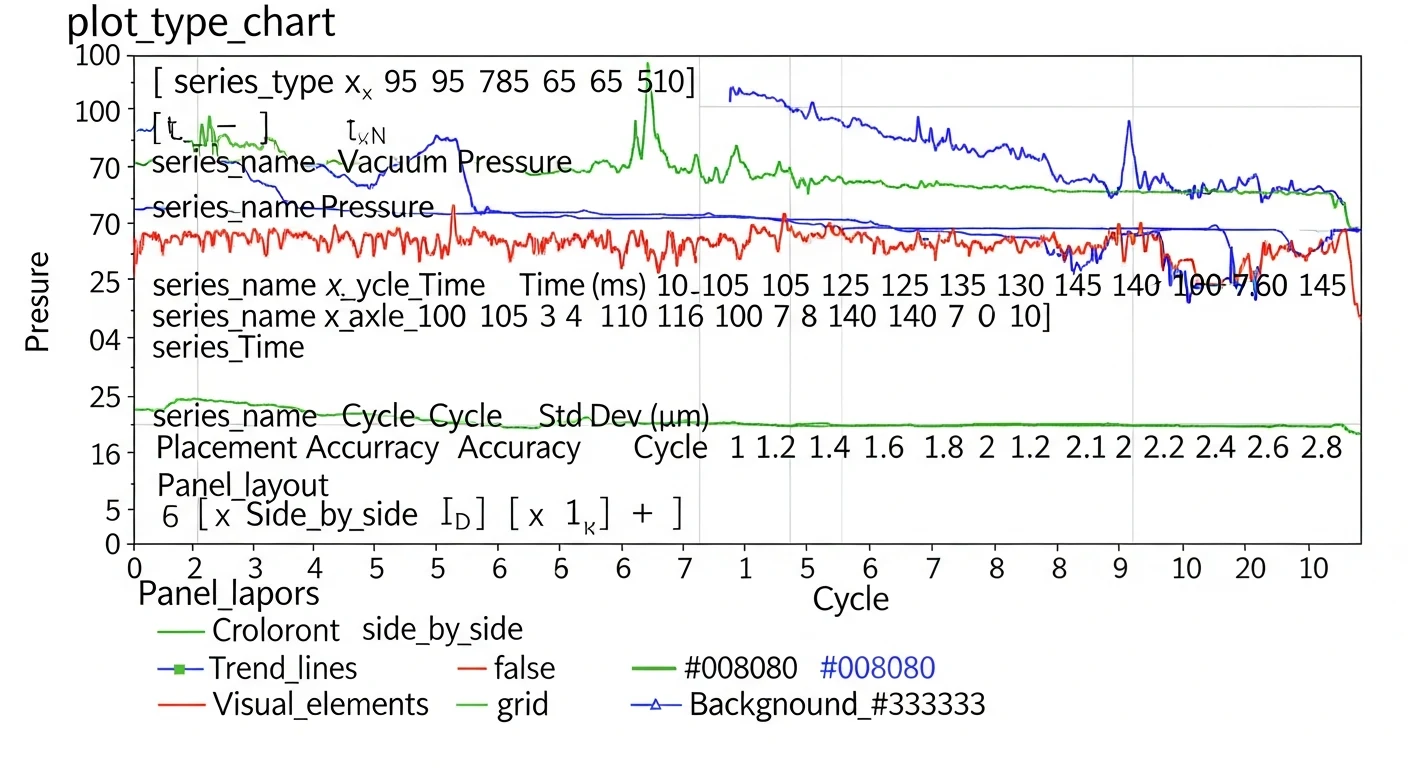
Three degradation signatures the assembly hub monitors:
Vacuum pressure drift. Each placement cycle logs the nozzle vacuum reading at pick. A healthy nozzle maintains a consistent vacuum level. A nozzle with a microcrack or worn seal shows a gradual downward trend in vacuum readings before it starts dropping components. Plotting the 50th and 5th percentile vacuum readings over time for each nozzle reveals this trend weeks before component drops begin.
Pick cycle time elongation. A placement head operating at normal mechanical condition completes pick cycles within a narrow time window. Elongating cycle times indicate increased friction in the linear rails — a lubrication maintenance signal that, if caught early, prevents the more expensive bearing replacement it leads to.
Placement accuracy drift. The machine vision system logs the delta between programmed placement coordinates and actual placement coordinates. Gradual drift in the mean of this distribution — even if it stays within tolerance — indicates thermal expansion compensation is losing calibration. Catching this at ±0.05mm drift prevents reaching the ±0.15mm point where placements start failing inspection.
From Analytics to Action
The analytics pipeline is most valuable when it connects to an action. A rolling defect rate chart that trends up is interesting; a rolling defect rate chart that triggers a Slack notification and opens a maintenance ticket in the engineering queue is useful.
The assembly hub's alerting layer runs as a scheduled background job, evaluating threshold rules against the latest analytics views and pushing notifications when conditions are met. The rules are stored as configurable parameters in the database — not hardcoded in Python — so manufacturing engineers can tune thresholds without touching code.
That configurability is what separates an analytics system that gets used from one that gets forgotten.